
Key Dates/Data Releases
11/26: GDP, durable goods orders, international trade in goods, new home sales, Personal Income and Outlays
Market Updates


As of Market Close November 21, 2025
Volatility continued to characterize the stock market last week. Wall Street endured significant swings driven by a mix of key corporate earnings reports, important economic data following the government’s reopening, and shifting expectations for the Federal Reserve interest rate policy. Each of the benchmark indexes listed here ended the week in the red, unable to recover from a sharp midweek sell-off, despite a rally last Friday. Most of the negative market returns were within the consumer discretionary and information technology sectors. Communication services outperformed last week. Tech shares took a notable downturn last week, despite a favorable earnings report from a major AI/tech giant. The release of the September jobs report (see below), delayed due to the government shutdown, provided mixed signals on the state of the U.S. economy in general and Federal Reserve policy in particular. Better-than-expected job growth was offset by an increase in the unemployment rate, which reinforced the Fed’s dilemma regarding future interest rate cuts. The yield on 10-year Treasuries eased slightly, ending the week down eight basis points. Oversupply concerns drove crude oil prices to a four-week low.
Stock Market Indexes
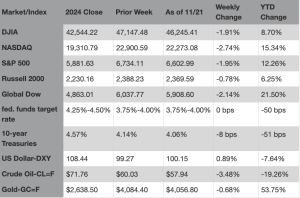
Chart reflects price changes, not total return. Because it does not include dividends or splits, it should not be used to benchmark performance of specific investments.
Last Week’s Economic News
- Following a more than six-week delay due to the government shutdown, the Bureau of Labor Statistics released employment data for September. Employment rose by 119,000 in September but has shown little change since April. In September, employment continued to trend up in health care, food services and drinking places, and social assistance. Job losses occurred in transportation and warehousing and in federal government. The total number of unemployed rose by 219,000 to 7.6 million, while the unemployment rate ticked up 0.1 percentage point to 4.4%. These measures were higher than a year earlier, when the jobless rate was 4.1%, and the number of unemployed people was 6.9 million. Following downward revisions, total employment in July and August combined was 33,000 lower than previously reported. The labor force participation rate (62.4%) and the employment-population ratio (59.7%) each rose 0.1 percentage point in September from the prior month. The number of long-term unemployed (those jobless for 27 weeks or more) dipped by 116,000 to 1.8 million in September. The long-term unemployed accounted for 23.6% of all unemployed people. Average hourly earnings rose by $0.09, or 0.2%, to $36.67 in September. Over the past 12 months, average hourly earnings have increased by 3.8%. In September, the average workweek was unchanged at 34.2 hours.
- For the week ended November 15, there were 220,000 new claims for unemployment insurance, a decrease of 8,000 from the previous week’s level. According to the Department of Labor, the advance rate for insured unemployment claims for the week ended November 8 was 1.3%, unchanged from the previous week’s rate. The advance number of those receiving unemployment insurance benefits during the week ended November 8 was 1,974,000, an increase of 28,000 from the previous week’s level. This was the highest level for insured unemployment since November 6, 2021, when it was 2,041,000. States and territories with the highest insured unemployment rates for the week ended November 1 were New Jersey (2.2%), Washington (2.1%), the District of Columbia (2.0%), California (1.9%), Massachusetts (1.9%), Puerto Rico (1.9%), Connecticut (1.7%), Nevada (1.7%), Oregon (1.7%), and Rhode Island (1.7%). The largest increases in initial claims for unemployment insurance for the week ended November 8 were in California (+6,728), New Jersey (+3,302), Texas (+3,101), Michigan (+2,598), and Pennsylvania (+1,816), while the largest decreases were in Kentucky (-5,500), Missouri (-3,166), Arkansas (-597), Indiana (-411), and Nebraska (-386).
- The national average retail price for regular gasoline was $3.062 per gallon on November 17, $0.006 per gallon above the prior week’s price and $0.016 per gallon higher than a year ago. Also, as of November 17, the East Coast price increased $0.041 to $2.953 per gallon; the Midwest price dipped $0.003 to $2.907 per gallon; the Gulf Coast price inched up $0.001 to $2.600 per gallon; the Rocky Mountain price rose $0.040 to $2.949 per gallon; and the West Coast price fell $0.039 to $4.120 per gallon.
Eye on the Week Ahead
The end of the government shutdown should result in the release of economic data and reports. We will continue to track the release of important economic reports as they become available.
Data sources: Economic: Based on data from U.S. Bureau of Labor Statistics (unemployment, inflation); U.S. Department of Commerce (GDP, corporate profits, retail sales, housing); S&P/Case-Shiller 20-City Composite Index (home prices); Institute for Supply Management (manufacturing/services). Performance: Based on data reported in WSJ Market Data Center (indexes); U.S. Treasury (Treasury yields); U.S. Energy Information Administration/Bloomberg.com Market Data (oil spot price, WTI, Cushing, OK); www.goldprice.org (spot gold/silver); Oanda/FX Street (currency exchange rates).
News items are based on reports from multiple commonly available international news sources (i.e., wire services) and are independently verified when necessary with secondary sources such as government agencies, corporate press releases, or trade organizations. All information is based on sources deemed reliable, but no warranty or guarantee is made as to its accuracy or completeness. Neither the information nor any opinion expressed herein constitutes a solicitation for the purchase or sale of any securities, and should not be relied on as financial advice. Forecasts are based on current conditions, subject to change, and may not come to pass. U.S. Treasury securities are guaranteed by the federal government as to the timely payment of principal and interest. The principal value of Treasury securities and other bonds fluctuates with market conditions. Bonds are subject to inflation, interest-rate, and credit risks. As interest rates rise, bond prices typically fall. A bond sold or redeemed prior to maturity may be subject to loss. Past performance is no guarantee of future results. All investing involves risk, including the potential loss of principal, and there can be no guarantee that any investing strategy will be successful.
The Dow Jones Industrial Average (DJIA) is a price-weighted index composed of 30 widely traded blue-chip U.S. common stocks. The S&P 500 is a market-cap weighted index composed of the common stocks of 500 largest, publicly traded companies in leading industries of the U.S. economy. The NASDAQ Composite Index is a market-value weighted index of all common stocks listed on the Nasdaq stock exchange. The Russell 2000 is a market-cap weighted index composed of 2,000 U.S. small-cap common stocks. The Global Dow is an equally weighted index of 150 widely traded blue-chip common stocks worldwide. The U.S. Dollar Index is a geometrically weighted index of the value of the U.S. dollar relative to six foreign currencies. Market indexes listed are unmanaged and are not available for direct investment.
Important Disclosures
Spire Wealth Management, LLC is a Federally Registered Investment Advisory Firm. Securities offered through an affiliated company, Spire Securities, LLC., a Registered Broker/Dealer and member FINRA/SIPC.
Neither Spire Wealth Management nor Corbett Road Wealth Management provide tax or legal advice. The information presented here is not specific to any individual’s personal circumstances. Please speak with your tax or legal professional.
These materials are provided for general information and educational purposes based upon publicly available information from sources believed to be reliable—we cannot assure the accuracy or completeness of these materials. The information in these materials may change at any time and without notice.
Prepared by Broadridge Advisor Solutions. ©2025 Broadridge Financial Services, Inc.


Key Dates/Data Releases
11/26: GDP, durable goods orders, international trade in goods, new home sales, Personal Income and Outlays
As of Market Close on November 14, 2025
Last week was marked by the re-opening of the U.S. government after a prolonged shutdown. However, despite a significant boost to the stock market at the beginning of the week, the positive momentum waned as the week progressed as investors were concerned about high valuation of AI stocks and uncertainty over Federal Reserve policy. The NASDAQ and the Russell 2000 ended the week in the red, while the S&P 500, the Dow, and the Global Dow closed higher. The AI sector, which has been a major market mover for much of the year, experienced significant volatility as investors worried about long-term sustainability. Health care, energy, and materials were market sector gainers, while consumer discretionary and communication services underperformed. Ten-year Treasury yields rose, likely reflecting reduced expectations for another interest rate cut at the next Federal Reserve meeting in December. Crude oil prices moved very little from the prior week as ongoing concerns surrounding increasing U.S. inventories and overproduction weighed on prices.
Stock Market Indexes
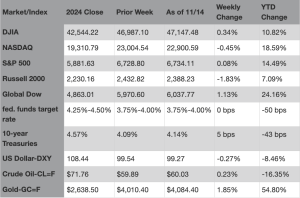
Chart reflects price changes, not total return. Because it does not include dividends or splits, it should not be used to benchmark performance of specific investments.
Last Week’s Economic News
- The release of most economic data continued to be delayed due to the government shutdown. However, as information becomes available, it will be included herein.
- The national average retail price for regular gasoline was $3.056 per gallon on November 10, $0.037 per gallon above the prior week’s price and $0.004 per gallon higher than a year ago. Also, as of November 10, the East Coast price decreased $0.005 to $2.912 per gallon; the Midwest price rose $0.082 to $2.910 per gallon; the Gulf Coast price increased $0.088 to $2.599 per gallon; the Rocky Mountain price dropped $0.029 to $2.909 per gallon; and the West Coast price rose $0.031 to $4.159 per gallon.
Eye on the Week Ahead
The end of the government shutdown should result in the release of economic data and reports. We will continue to track the release of important economic reports as they become available.
Data sources: Economic: Based on data from U.S. Bureau of Labor Statistics (unemployment, inflation); U.S. Department of Commerce (GDP, corporate profits, retail sales, housing); S&P/Case-Shiller 20-City Composite Index (home prices); Institute for Supply Management (manufacturing/services). Performance: Based on data reported in WSJ Market Data Center (indexes); U.S. Treasury (Treasury yields); U.S. Energy Information Administration/Bloomberg.com Market Data (oil spot price, WTI, Cushing, OK); www.goldprice.org (spot gold/silver); Oanda/FX Street (currency exchange rates).
News items are based on reports from multiple commonly available international news sources (i.e., wire services) and are independently verified when necessary with secondary sources such as government agencies, corporate press releases, or trade organizations. All information is based on sources deemed reliable, but no warranty or guarantee is made as to its accuracy or completeness. Neither the information nor any opinion expressed herein constitutes a solicitation for the purchase or sale of any securities, and should not be relied on as financial advice. Forecasts are based on current conditions, subject to change, and may not come to pass. U.S. Treasury securities are guaranteed by the federal government as to the timely payment of principal and interest. The principal value of Treasury securities and other bonds fluctuates with market conditions. Bonds are subject to inflation, interest-rate, and credit risks. As interest rates rise, bond prices typically fall. A bond sold or redeemed prior to maturity may be subject to loss. Past performance is no guarantee of future results. All investing involves risk, including the potential loss of principal, and there can be no guarantee that any investing strategy will be successful.
The Dow Jones Industrial Average (DJIA) is a price-weighted index composed of 30 widely traded blue-chip U.S. common stocks. The S&P 500 is a market-cap weighted index composed of the common stocks of 500 largest, publicly traded companies in leading industries of the U.S. economy. The NASDAQ Composite Index is a market-value weighted index of all common stocks listed on the Nasdaq stock exchange. The Russell 2000 is a market-cap weighted index composed of 2,000 U.S. small-cap common stocks. The Global Dow is an equally weighted index of 150 widely traded blue-chip common stocks worldwide. The U.S. Dollar Index is a geometrically weighted index of the value of the U.S. dollar relative to six foreign currencies. Market indexes listed are unmanaged and are not available for direct investment.
Important Disclosures
Spire Wealth Management, LLC is a Federally Registered Investment Advisory Firm. Securities offered through an affiliated company, Spire Securities, LLC., a Registered Broker/Dealer and member FINRA/SIPC.
Neither Spire Wealth Management nor Corbett Road Wealth Management provide tax or legal advice. The information presented here is not specific to any individual’s personal circumstances. Please speak with your tax or legal professional.
These materials are provided for general information and educational purposes based upon publicly available information from sources believed to be reliable—we cannot assure the accuracy or completeness of these materials. The information in these materials may change at any time and without notice.
Prepared by Broadridge Advisor Solutions. ©2025 Broadridge Financial Services, Inc.


Key Dates/Data Releases
11/13: CPI, Monthly Treasury Statement
11/14: PPI, retail sales
The Markets (as of market close November 7, 2025)
The multi-week bull run ended last week, halted by a notable selloff of tech stocks. The NASDAQ experienced a sharp correction, driven by concerns of overpricing and high valuations, particularly in the technology sector. The S&P 500 suffered its worst week in a month, while the Russell 2000 and the Dow also lost value. Most reporting S&P companies have exceeded profit estimates, but a few major companies disappointed, which weighed on market sentiment. Economic uncertainty, exacerbated by the ongoing government shutdown, appeared to further escalate investor concerns. Among the market sectors, information technology, communication services, and consumer discretionary fell the furthest, while health care, real estate, energy, and financials outperformed. Crude oil prices faced downward pressure, resulting in a drop in prices for the second straight week. The fall in crude oil prices was largely influenced by surging U.S. inventories, an increase in production by OPEC+, and a price cut by Saudi Arabia.
Stock Market Indexes
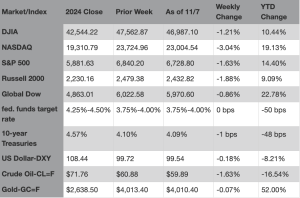
Chart reflects price changes, not total return. Because it does not include dividends or splits, it should not be used to benchmark performance of specific investments.
Last Week’s Economic News
- The release of most economic data has been delayed due to the government shutdown.
- Manufacturing output ticked higher in October, fueled by the best gain in new orders in the last 20 months. However, growth was primarily led by domestic orders, as new export orders fell due to tariffs negatively impacting international trade. The S&P Global US Manufacturing Purchasing Managers’ Index™ recorded 52.5 in October, compared to 52.0 in September.
- According to S&P Global, the service sector registered a solid and accelerated pace of growth during October. Increased output was accompanied by a firm rise in new business, although uncertainty over the economic and political outlook attributed to only modest hiring growth, while confidence about the future fell to a six-month low. The S&P Global US Services PMI® Business Activity Index edged higher in October, rising to 54.8 from September’s 54.2.
- The national average retail price for regular gasoline was $3.019 per gallon on November 3, $0.016 per gallon below the prior week’s price and $0.050 per gallon less than a year ago. Also, as of November 3, the East Coast price increased $0.007 to $2.917 per gallon; the Midwest price fell $0.025 to $2.828 per gallon; the Gulf Coast price declined $0.069 to $2.511 per gallon; the Rocky Mountain price dropped $0.034 to $2.938 per gallon; and the West Coast price rose $0.022 to $4.128 per gallon.
Eye on the Week Ahead
There will be little relevant economic data available during the government shutdown.
Data sources: Economic: Based on data from U.S. Bureau of Labor Statistics (unemployment, inflation); U.S. Department of Commerce (GDP, corporate profits, retail sales, housing); S&P/Case-Shiller 20-City Composite Index (home prices); Institute for Supply Management (manufacturing/services). Performance: Based on data reported in WSJ Market Data Center (indexes); U.S. Treasury (Treasury yields); U.S. Energy Information Administration/Bloomberg.com Market Data (oil spot price, WTI, Cushing, OK); www.goldprice.org (spot gold/silver); Oanda/FX Street (currency exchange rates).
News items are based on reports from multiple commonly available international news sources (i.e., wire services) and are independently verified when necessary with secondary sources such as government agencies, corporate press releases, or trade organizations. All information is based on sources deemed reliable, but no warranty or guarantee is made as to its accuracy or completeness. Neither the information nor any opinion expressed herein constitutes a solicitation for the purchase or sale of any securities, and should not be relied on as financial advice. Forecasts are based on current conditions, subject to change, and may not come to pass. U.S. Treasury securities are guaranteed by the federal government as to the timely payment of principal and interest. The principal value of Treasury securities and other bonds fluctuates with market conditions. Bonds are subject to inflation, interest-rate, and credit risks. As interest rates rise, bond prices typically fall. A bond sold or redeemed prior to maturity may be subject to loss. Past performance is no guarantee of future results. All investing involves risk, including the potential loss of principal, and there can be no guarantee that any investing strategy will be successful.
The Dow Jones Industrial Average (DJIA) is a price-weighted index composed of 30 widely traded blue-chip U.S. common stocks. The S&P 500 is a market-cap weighted index composed of the common stocks of 500 largest, publicly traded companies in leading industries of the U.S. economy. The NASDAQ Composite Index is a market-value weighted index of all common stocks listed on the Nasdaq stock exchange. The Russell 2000 is a market-cap weighted index composed of 2,000 U.S. small-cap common stocks. The Global Dow is an equally weighted index of 150 widely traded blue-chip common stocks worldwide. The U.S. Dollar Index is a geometrically weighted index of the value of the U.S. dollar relative to six foreign currencies. Market indexes listed are unmanaged and are not available for direct investment.
IMPORTANT DISCLOSURES
Spire Wealth Management, LLC is a Federally Registered Investment Advisory Firm. Securities offered through an affiliated company, Spire Securities, LLC., a Registered Broker/Dealer and member FINRA/SIPC.
Neither Spire Wealth Management nor Corbett Road Wealth Management provide tax or legal advice. The information presented here is not specific to any individual’s personal circumstances. Please speak with your tax or legal professional.
These materials are provided for general information and educational purposes based upon publicly available information from sources believed to be reliable—we cannot assure the accuracy or completeness of these materials. The information in these materials may change at any time and without notice.
Prepared by Broadridge Advisor Solutions. ©2025 Broadridge Financial Services, Inc


Key Dates/Data Releases
11/3: S&P Global manufacturing PMI
11/4: International trade in goods and services, JOLTS
11/5: S&P Global services PMI
11/7: Employment Situation
The Markets (as of market close October 31, 2025)
Stocks moved generally higher last week, largely driven by solid corporate earnings from some big tech firms. The S&P 500 and the NASDAQ each reached record highs during the week, extending a significant rally. The push higher was moderated somewhat by the Federal Reserve’s cautious stance on future rate cuts. Despite a lack of updated economic information, the Fed identified concerns about the potential for a weakening job market and stubbornly elevated inflation rates. While trade tensions between the U.S. and China were tempered following a meeting between President Trump and Chinese leader Xi Jinping, analysts cautioned that underlying issues still had not been resolved. Following last week’s interest rate cut, U.S. Treasury yields rose sharply, extending a three-session rally that pushed the 10-year Treasury yield to a three-week high. Despite an early-week rally, crude oil prices dipped lower last week, primarily due to concerns of global oversupply and increased production.
Stock Market Indexes
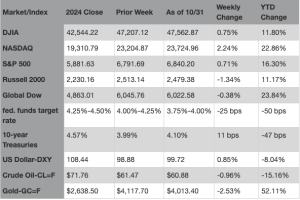
Chart reflects price changes, not total return. Because it does not include dividends or splits, it should not be used to benchmark performance of specific investments.
Last Week’s Economic News
- The release of most economic data has been delayed due to the government shutdown.
- The Federal Open Market Committee lowered the federal funds rate by 25 basis points to 3.75%-4.00% following its meeting last week. This marks the lowest range for the federal funds rate since 2022. The decision was based on a 10-2 vote, with Stephen I. Miran preferring to lower the target range for the federal funds rate by 50 basis points, while Jeffrey R. Schmid voted for no change to the target range for the federal funds rate. In seeking to achieve its mandate of maximum employment and inflation at 2.0% over the longer run, the Committee based its rate cut on rising downside risks to employment and elevated inflation.
- The federal government enjoyed a surplus of $198 billion in September, the last month of fiscal year 2025. Government receipts were $544 billion, while expenditures totaled $346 billion. For fiscal year 2025, total receipts were $5,235 billion, while outlays were $7,010 billion, leaving a deficit of $1,775 billion, which was less than the FY2024 deficit of $1,817 billion.
- The national average retail price for regular gasoline was $3.035 per gallon on October 27, $0.016 per gallon above the prior week’s price but $0.062 per gallon less than a year ago. Also, as of October 27, the East Coast price increased $0.008 to $2.910 per gallon; the Midwest price rose $0.068 to $2.873 per gallon; the Gulf Coast price climbed $0.024 to $2.580 per gallon; the Rocky Mountain price dropped $0.025 to $2.972 per gallon; and the West Coast price dipped $0.060 to $4.106 per gallon.
Eye on the Week Ahead
There will be little relevant economic data available during the government shutdown.
Data sources: Economic: Based on data from U.S. Bureau of Labor Statistics (unemployment, inflation); U.S. Department of Commerce (GDP, corporate profits, retail sales, housing); S&P/Case-Shiller 20-City Composite Index (home prices); Institute for Supply Management (manufacturing/services). Performance: Based on data reported in WSJ Market Data Center (indexes); U.S. Treasury (Treasury yields); U.S. Energy Information Administration/Bloomberg.com Market Data (oil spot price, WTI, Cushing, OK); www.goldprice.org (spot gold/silver); Oanda/FX Street (currency exchange rates).
News items are based on reports from multiple commonly available international news sources (i.e., wire services) and are independently verified when necessary with secondary sources such as government agencies, corporate press releases, or trade organizations. All information is based on sources deemed reliable, but no warranty or guarantee is made as to its accuracy or completeness. Neither the information nor any opinion expressed herein constitutes a solicitation for the purchase or sale of any securities, and should not be relied on as financial advice. Forecasts are based on current conditions, subject to change, and may not come to pass. U.S. Treasury securities are guaranteed by the federal government as to the timely payment of principal and interest. The principal value of Treasury securities and other bonds fluctuates with market conditions. Bonds are subject to inflation, interest-rate, and credit risks. As interest rates rise, bond prices typically fall. A bond sold or redeemed prior to maturity may be subject to loss. Past performance is no guarantee of future results. All investing involves risk, including the potential loss of principal, and there can be no guarantee that any investing strategy will be successful.
The Dow Jones Industrial Average (DJIA) is a price-weighted index composed of 30 widely traded blue-chip U.S. common stocks. The S&P 500 is a market-cap weighted index composed of the common stocks of 500 largest, publicly traded companies in leading industries of the U.S. economy. The NASDAQ Composite Index is a market-value weighted index of all common stocks listed on the Nasdaq stock exchange. The Russell 2000 is a market-cap weighted index composed of 2,000 U.S. small-cap common stocks. The Global Dow is an equally weighted index of 150 widely traded blue-chip common stocks worldwide. The U.S. Dollar Index is a geometrically weighted index of the value of the U.S. dollar relative to six foreign currencies. Market indexes listed are unmanaged and are not available for direct investment.
IMPORTANT DISCLOSURES
Spire Wealth Management, LLC is a Federally Registered Investment Advisory Firm. Securities offered through an affiliated company, Spire Securities, LLC., a Registered Broker/Dealer and member FINRA/SIPC.
Neither Spire Wealth Management nor Corbett Road Wealth Management provide tax or legal advice. The information presented here is not specific to any individual’s personal circumstances. Please speak with your tax or legal professional.
These materials are provided for general information and educational purposes based upon publicly available information from sources believed to be reliable—we cannot assure the accuracy or completeness of these materials. The information in these materials may change at any time and without notice.
Prepared by Broadridge Advisor Solutions. © 2025 Broadridge Financial Services, Inc.

Key Dates/Data Releases
10/27: Durable goods orders
10/29: FOMC meeting statement
10/30: GDP
10/31: Personal Income and Outlays
The Markets (as of market close October 24, 2025)
The major stock market indexes continued to climb last week, with the S&P 500 and the NASDAQ reaching new record highs. Investors were buoyed by a strong start to the third-quarter earnings season, particularly for major banks, with most companies reporting better-than-expected earnings and profits. On the global front, the announcement of a meeting between the United States and China muted concerns surrounding trade tariffs. While consumer prices rose in September, the advance was softer than expected, bolstering hopes for an interest rate cut by the Federal Reserve following its meeting this week. Among the market sectors, information technology and communication services were the leading performers. Ten-year Treasury yields were generally lower last week, dipping below 4.0%. Gold prices, which had been on a notable rally, declined last week, largely due to profit-taking and a reduction in safe-haven demand. Crude oil prices were volatile throughout the week, falling to their lowest levels in months, only to surge later in the week after the U.S. sanctioned two major Russian oil firms.
Stock Market Indexes

Chart reflects price changes, not total return. Because it does not include dividends or splits, it should not be used to benchmark performance of specific investments.
Last Week’s Economic News
- The release of most economic data has been delayed due to the government shutdown.
- The Consumer Price Index (CPI) increased 0.3% in September following a 0.4% rise in August. Note: The September CPI data collection was completed before the government shutdown. In September, prices for gasoline rose 4.1% and were the largest factors in the overall monthly increase. Prices for energy rose 1.5% over the month. Food prices increased 0.2% last month. Consumer prices less food and energy rose 0.2% in September after rising 0.3% in each of the two preceding months. The CPI rose 3.0% for the 12 months ended in September after rising 2.9% over the 12 months ended in August. Prices less food and energy also rose 3.0% over the last 12 months. Energy prices increased 2.8% for the year. Prices for food increased 3.1% since September 2024.
- Existing-home sales rose 1.5% in September 2025. According to National Association of Realtors® Chief Economist Lawrence Yun, “As anticipated, falling mortgage rates are lifting home sales. Improving housing affordability is also contributing to the increase in sales.” Since September 2024, sales of existing homes have risen 4.1%. At a 4.6-month supply in September, unsold inventory was up 1.3% from the prior month and 14.0% from a year ago. The median existing-home price was $415,200 in September, down 1.7% from the August price of $422,400 but up 2.1% from one year ago ($406,700). Sales of existing single-family homes rose 1.7% in September from August and 4.5% from September 2024. The median existing single-family home price in September was $420,700, down from the August price of $427,700 but higher than the September 2024 price of $411,400.
- The national average retail price for regular gasoline was $3.019 per gallon on October 20, $0.042 per gallon below the prior week’s price and $0.125 per gallon less than a year ago. Also, as of October 20, the East Coast price decreased $0.050 to $2.902 per gallon; the Midwest price fell $0.007 to $2.805 per gallon; the Gulf Coast price declined $0.067 to $2.556 per gallon; the Rocky Mountain price dropped $0.052 to $2.997 per gallon; and the West Coast price dipped $0.047 to $4.166 per gallon.
Eye on the Week Ahead
There will be little relevant economic data available during the government shutdown, with the exception of this week’s Federal Open Market meeting.
Data sources: Economic: Based on data from U.S. Bureau of Labor Statistics (unemployment, inflation); U.S. Department of Commerce (GDP, corporate profits, retail sales, housing); S&P/Case-Shiller 20-City Composite Index (home prices); Institute for Supply Management (manufacturing/services). Performance: Based on data reported in WSJ Market Data Center (indexes); U.S. Treasury (Treasury yields); U.S. Energy Information Administration/Bloomberg.com Market Data (oil spot price, WTI, Cushing, OK); www.goldprice.org (spot gold/silver); Oanda/FX Street (currency exchange rates).
News items are based on reports from multiple commonly available international news sources (i.e., wire services) and are independently verified when necessary with secondary sources such as government agencies, corporate press releases, or trade organizations. All information is based on sources deemed reliable, but no warranty or guarantee is made as to its accuracy or completeness. Neither the information nor any opinion expressed herein constitutes a solicitation for the purchase or sale of any securities, and should not be relied on as financial advice. Forecasts are based on current conditions, subject to change, and may not come to pass. U.S. Treasury securities are guaranteed by the federal government as to the timely payment of principal and interest. The principal value of Treasury securities and other bonds fluctuates with market conditions. Bonds are subject to inflation, interest-rate, and credit risks. As interest rates rise, bond prices typically fall. A bond sold or redeemed prior to maturity may be subject to loss. Past performance is no guarantee of future results. All investing involves risk, including the potential loss of principal, and there can be no guarantee that any investing strategy will be successful.
The Dow Jones Industrial Average (DJIA) is a price-weighted index composed of 30 widely traded blue-chip U.S. common stocks. The S&P 500 is a market-cap weighted index composed of the common stocks of 500 largest, publicly traded companies in leading industries of the U.S. economy. The NASDAQ Composite Index is a market-value weighted index of all common stocks listed on the Nasdaq stock exchange. The Russell 2000 is a market-cap weighted index composed of 2,000 U.S. small-cap common stocks. The Global Dow is an equally weighted index of 150 widely traded blue-chip common stocks worldwide. The U.S. Dollar Index is a geometrically weighted index of the value of the U.S. dollar relative to six foreign currencies. Market indexes listed are unmanaged and are not available for direct investment.
IMPORTANT DISCLOSURES
Spire Wealth Management, LLC is a Federally Registered Investment Advisory Firm. Securities offered through an affiliated company, Spire Securities, LLC., a Registered Broker/Dealer and member FINRA/SIPC.
Neither Spire Wealth Management nor Corbett Road Wealth Management provide tax or legal advice. The information presented here is not specific to any individual’s personal circumstances. Please speak with your tax or legal professional.
These materials are provided for general information and educational purposes based upon publicly available information from sources believed to be reliable—we cannot assure the accuracy or completeness of these materials. The information in these materials may change at any time and without notice.
Prepared by Broadridge Advisor Solutions. © 2025 Broadridge Financial Services, Inc.


Key Dates/Data Releases
10/23: Existing home sales
10/24: New home sales
The Markets (as of market close October 17, 2025)
Last week saw another period of volatility in the stock market, largely driven by U.S.-China trade tensions, the ongoing government shutdown, and concerns over the health of the banking sector. Despite market swings throughout the week, stocks ultimately pushed higher by week’s end, with each of the benchmark indexes listed here posting gains. The financial sector was a major source of volatility last week after reports of loan issues related to alleged fraud at some regional banks sparked credit concerns. However, stronger-than-expected third-quarter earnings data from some major banks helped quell investor consternation. The 10-year Treasury yields dipped below 4.00% midweek before climbing later in the week. Crude oil prices declined for the third straight week, while gold prices surged past $4,300.00 per ounce earlier in the week before settling at nearly $4,250.00.
Stock Market Indexes

Chart reflects price changes, not total return. Because it does not include dividends or splits, it should not be used to benchmark performance of specific investments.
Last Week’s Economic News
- The release of most economic data has been delayed due to the government shutdown.
- The national average retail price for regular gasoline was $3.061 per gallon on October 13, $0.063 per gallon below the prior week’s price and $0.110 per gallon less than a year ago. Also, as of October 13, the East Coast price ticked down $0.032 to $2.952 per gallon; the Midwest price fell $0.121 to $2.812 per gallon; the Gulf Coast price decreased $0.096 to $2.623 per gallon; the Rocky Mountain price dropped $0.017 to $3.049 per gallon; and the West Coast price dipped $0.013 to $4.213 per gallon.
Eye on the Week Ahead
There will be little relevant economic data available during the government shutdown.
Data sources: Economic: Based on data from U.S. Bureau of Labor Statistics (unemployment, inflation); U.S. Department of Commerce (GDP, corporate profits, retail sales, housing); S&P/Case-Shiller 20-City Composite Index (home prices); Institute for Supply Management (manufacturing/services). Performance: Based on data reported in WSJ Market Data Center (indexes); U.S. Treasury (Treasury yields); U.S. Energy Information Administration/Bloomberg.com Market Data (oil spot price, WTI, Cushing, OK); www.goldprice.org (spot gold/silver); Oanda/FX Street (currency exchange rates).
News items are based on reports from multiple commonly available international news sources (i.e., wire services) and are independently verified when necessary with secondary sources such as government agencies, corporate press releases, or trade organizations. All information is based on sources deemed reliable, but no warranty or guarantee is made as to its accuracy or completeness. Neither the information nor any opinion expressed herein constitutes a solicitation for the purchase or sale of any securities, and should not be relied on as financial advice. Forecasts are based on current conditions, subject to change, and may not come to pass. U.S. Treasury securities are guaranteed by the federal government as to the timely payment of principal and interest. The principal value of Treasury securities and other bonds fluctuates with market conditions. Bonds are subject to inflation, interest-rate, and credit risks. As interest rates rise, bond prices typically fall. A bond sold or redeemed prior to maturity may be subject to loss. Past performance is no guarantee of future results. All investing involves risk, including the potential loss of principal, and there can be no guarantee that any investing strategy will be successful.
The Dow Jones Industrial Average (DJIA) is a price-weighted index composed of 30 widely traded blue-chip U.S. common stocks. The S&P 500 is a market-cap weighted index composed of the common stocks of 500 largest, publicly traded companies in leading industries of the U.S. economy. The NASDAQ Composite Index is a market-value weighted index of all common stocks listed on the Nasdaq stock exchange. The Russell 2000 is a market-cap weighted index composed of 2,000 U.S. small-cap common stocks. The Global Dow is an equally weighted index of 150 widely traded blue-chip common stocks worldwide. The U.S. Dollar Index is a geometrically weighted index of the value of the U.S. dollar relative to six foreign currencies. Market indexes listed are unmanaged and are not available for direct investment.
IMPORTANT DISCLOSURES
Spire Wealth Management, LLC is a Federally Registered Investment Advisory Firm. Securities offered through an affiliated company, Spire Securities, LLC., a Registered Broker/Dealer and member FINRA/SIPC.
Neither Spire Wealth Management nor Corbett Road Wealth Management provide tax or legal advice. The information presented here is not specific to any individual’s personal circumstances. Please speak with your tax or legal professional.
These materials are provided for general information and educational purposes based upon publicly available information from sources believed to be reliable—we cannot assure the accuracy or completeness of these materials. The information in these materials may change at any time and without notice.
Prepared by Broadridge Advisor Solutions. ©2025 Broadridge Financial Services, Inc.

Key Dates/Data Releases
10/15: Consumer Price Index
10/16: Producer Price Index, retail sales
10/17: Housing starts, import and export prices, industrial production
As of Market Close October 10, 2025
Wall Street was marked by volatility throughout last week. Major indexes, particularly the S&P 500 and the NASDAQ, reached new record highs earlier in the week, driven by an advance in AI stocks and favorable corporate earnings reports. However, the market endured a significant selloff last Friday, reversing much of the week’s earlier gains. Investor sentiment turned negative following a threat by President Trump to impose a “massive increase in tariffs” on Chinese imports, reigniting fears of a trade war. As a result, the S&P 500 declined following a seven-day winning streak. The Dow also declined, while the NASDAQ saw the sharpest losses, with tech shares among the biggest decliners. The government shutdown continued into its second week, increasing uncertainty and delaying the release of key economic data. Ten-year Treasury yields fell below 4.10%, while gold prices climbed above $4,000.00 per ounce, a jump that could be a sign of investor anxiety over deficits and potential inflation.
Stock Market Indexes

Chart reflects price changes, not total return. Because it does not include dividends or splits, it should not be used to benchmark performance of specific investments.
Last Week’s Economic News
- The release of most economic data has been delayed due to the government shutdown.
- The national average retail price for regular gasoline was $3.124 per gallon on October 6, $0.006 per gallon above the prior week’s price but $0.012 per gallon less than a year ago. Also, as of October 6, the East Coast price ticked up $0.001 to $2.984 per gallon; the Midwest price rose $0.005 to $2.933 per gallon; the Gulf Coast price increased $0.047 to $2.719 per gallon; the Rocky Mountain price decreased $0.044 to $3.066 per gallon; and the West Coast price dipped $0.012 to $4.226 per gallon.
Eye on the Week Ahead
Inflation data for September is ordinarily out this week with the release of the Consumer Price Index. However, the government shutdown has delayed the release of this information.
Data sources: Economic: Based on data from U.S. Bureau of Labor Statistics (unemployment, inflation); U.S. Department of Commerce (GDP, corporate profits, retail sales, housing); S&P/Case-Shiller 20-City Composite Index (home prices); Institute for Supply Management (manufacturing/services). Performance: Based on data reported in WSJ Market Data Center (indexes); U.S. Treasury (Treasury yields); U.S. Energy Information Administration/Bloomberg.com Market Data (oil spot price, WTI, Cushing, OK); www.goldprice.org (spot gold/silver); Oanda/FX Street (currency exchange rates).
News items are based on reports from multiple commonly available international news sources (i.e., wire services) and are independently verified when necessary with secondary sources such as government agencies, corporate press releases, or trade organizations. All information is based on sources deemed reliable, but no warranty or guarantee is made as to its accuracy or completeness. Neither the information nor any opinion expressed herein constitutes a solicitation for the purchase or sale of any securities, and should not be relied on as financial advice. Forecasts are based on current conditions, subject to change, and may not come to pass. U.S. Treasury securities are guaranteed by the federal government as to the timely payment of principal and interest. The principal value of Treasury securities and other bonds fluctuates with market conditions. Bonds are subject to inflation, interest-rate, and credit risks. As interest rates rise, bond prices typically fall. A bond sold or redeemed prior to maturity may be subject to loss. Past performance is no guarantee of future results. All investing involves risk, including the potential loss of principal, and there can be no guarantee that any investing strategy will be successful.
The Dow Jones Industrial Average (DJIA) is a price-weighted index composed of 30 widely traded blue-chip U.S. common stocks. The S&P 500 is a market-cap weighted index composed of the common stocks of 500 largest, publicly traded companies in leading industries of the U.S. economy. The NASDAQ Composite Index is a market-value weighted index of all common stocks listed on the Nasdaq stock exchange. The Russell 2000 is a market-cap weighted index composed of 2,000 U.S. small-cap common stocks. The Global Dow is an equally weighted index of 150 widely traded blue-chip common stocks worldwide. The U.S. Dollar Index is a geometrically weighted index of the value of the U.S. dollar relative to six foreign currencies. Market indexes listed are unmanaged and are not available for direct investment.
Important Disclosures
Spire Wealth Management, LLC is a Federally Registered Investment Advisory Firm. Securities offered through an affiliated company, Spire Securities, LLC., a Registered Broker/Dealer and member FINRA/SIPC.
Neither Spire Wealth Management nor Corbett Road Wealth Management provide tax or legal advice. The information presented here is not specific to any individual’s personal circumstances. Please speak with your tax or legal professional.
These materials are provided for general information and educational purposes based upon publicly available information from sources believed to be reliable—we cannot assure the accuracy or completeness of these materials. The information in these materials may change at any time and without notice.
Prepared by Broadridge Advisor Solutions. ©2025 Broadridge Financial Services, Inc.
Calculators
Link Disclosure: The information being provided is strictly as a courtesy. When you click on any of the links provided here, you are leaving this website and viewing information provided by a third party. We make no representation as to the completeness or accuracy of information provided by any third-party website. Nor is the company liable for any direct or indirect technical or system issues or any consequences arising out of your access to or your use of third-party technologies, websites, information, and programs made available through this website. By accessing these calculators, you assume total responsibility and risk for your use of the third-party website.
Auto
Cash Flow
College
Credit
FINRA Calculators
Home & Mortgage
Insurance
Paycheck & Benefits
Retirement
Savings
Taxation
About Corbett Road
Useful Links
Contact Us
Toll Free: 844.688.4955
E-mail: info@corbettroad.com
7901 Jones Branch Drive Suite 800 McLean, VA 22102
7901 Jones Branch Drive Suite 800 McLean, VA 22102
All third-party trademarks and service marks on the Corbett Road Wealth Management website (www.corbettroad.com) are the property of their respective owners, and the use of these names, trademarks and brands does not imply endorsement.
Spire Wealth Management, LLC is a Federally Registered Investment Advisory firm. Securities offered through an affiliate, Spire Securities, LLC. Member FINRA/SIPC | DISCLAIMERS.
©Copyright 2024 Corbett Road Wealth Management. All rights reserved. FINRA Broker Check Spire Investment Partners