

Rush Zarrabian, CFA®
Corbett Road
Managing Partner, Portfolio Manager
—
July 17, 2024
Summary
-
macrocast™ remains positive and suggests the risk of a recessionary bear market in 2024 is low. Our microcast™ signal continues to recommend an aggressive allocation, a stance that has been maintained since August 2023.
-
Currently, the macrocast™ score is positive but below typical bull market levels, primarily due to weaker economic growth and elevated stock valuations. While high valuations alone don’t predict a decline, they suggest limited room for error if economic conditions worsen or inflation resurfaces.
-
US large-cap stocks—led by Big Tech—drove the market higher in the first half, with the S&P 500 returning over 15%. However, the average stock underperformed. The Equal Weighted S&P 500 fell by 2.63% in Q2 while small-cap stocks lagged significantly, widening the gap with large caps. Bonds ended the quarter positively but remain below their peak, continuing to drag on asset allocation portfolios.
-
While historical trends strongly indicate that the stock market is likely to continue its upward trajectory in the second half of 2024, a pullback is not out of the question. When the market sees double-digit gains through June, the average correction in the second half is around 9%. Investors should anticipate these typical fluctuations despite the generally positive outlook.
THE MESSAGE FROM macrocast™: LOWER INFLATION, BUT ALSO LOWER ECONOMIC GROWTH
As a reminder, macrocast™ is Corbett Road’s proprietary investment model. macrocast™ measures the appeal of risk assets by looking at the VITALS of the market—Valuation, Inflation, Technical Analysis, Aggregate Economy, Liquidity, and Sentiment. By looking at multiple factors, we seek to better gauge market conditions and the probability of a sustained, recessionary market decline.
In last month’s Macro Musings, we noted that our recent macrocast™ updates are not directly comparable to previous months due to adjustments made to the model’s underlying indicators.
That said, the current macrocast™ score, while positive, remains below levels typically seen during bull markets. The primary factor driving the score lower is weaker economic data; specifically, metrics tracking the financial well-being of consumers.
Furthermore, stock valuations remain elevated compared to historical norms, which is also dragging down the macrocast™ score. However, this doesn’t automatically signal an impending decline because valuation alone is not a reliable short-term timing indicator.
A positive but lower score suggests macrocast™ has a small cushion before taking action to reduce risk. If the economy slows further or inflation resurfaces, the signal could quickly turn negative. Although we consider neither scenario likely, the low macrocast™ score reflects a limited margin for error.
FIRST HALF 2024 ASSET CLASS REVIEW
The following table highlights major asset class returns during the second quarter and the first half of the year (from Charles Schwab):
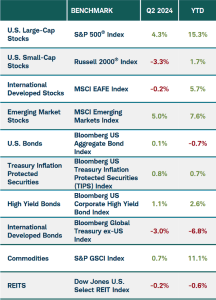
Some additional insights from the table:
- US large-cap stocks continue to dominate, led by Big Tech. The S&P 500, a benchmark index for US large-cap stocks, returned over 15% in the first half of the year, making it the top-performing major asset class. These gains were once again driven by the Magnificent 7—a group of Big Tech stocks that includes Microsoft, Apple, Google-parent Alphabet, Facebook-parent Meta, Amazon, Nvidia, and Tesla. This basket of seven companies returned +34.9% in the first half of 2024.
- The average stock in the index performed poorly. While the S&P 500 saw further gains in Q2, most of the actual stocks in the index did much worse. This is because the S&P 500 is a market cap weighted index, which gives greater weight to the larger companies that have continued to outperform. The Equal Weighted S&P 500 index, which neutralizes the influence of the largest companies, actually declined by 2.63% in Q2.
- Small caps lagged badly. While Big Tech stocks have fueled gains in the S&P 500, small-cap indices lack such companies, contributing to their relative underperformance. Additionally, small caps tend to be less profitable and more levered, making this group of stocks more sensitive to higher interest rates. At the end of Q2, the gap between large- and small-cap stocks sat near record levels; however, small caps have rebounded over the past week as lower inflation has reignited hopes of rate cuts later this year.
- Bonds ended the first half slightly lower. Bonds finished Q2 on a positive note but have continued to be a slight drag on asset allocation portfolios year-to-date. While the S&P 500 achieved several new all-time highs during the first half, the Bloomberg Aggregate Bond Index was still 10% below its all-time peak at the end of Q2.
A STRONG FIRST HALF OFTEN LEADS TO FURTHER GAINS, BUT CORRECTION RISKS REMAIN
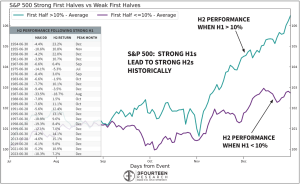
Historical trends point to a strong likelihood of the stock market rising in the second half of 2024. On average, stocks tend to perform better when the market rises more than 10% from January through June (chart from 3Fourteen Research):
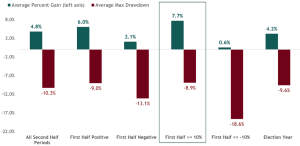
So, if history suggests better than average gains in the second half, does that mean a correction is less likely? Not necessarily. On average, the max drawdown in the second half of the year is around 9% following a strong first half. Thus, while the overall trend might be positive, investors should still be prepared for typical market fluctuations and potential corrections. (Chart from LPL):
Predicting the timing of negative market-moving events is difficult, but several potential catalysts loom.
At the end of August, the Fed is holding its annual Jackson Hole symposium where Fed Chair Jerome Powell is expected to outline the trajectory for rate cuts through the end of the year. Currently, markets anticipate a .25% cut in September, November, and December. If Powell forecasts fewer cuts than expected, it could produce volatility and send stocks lower.
The second major upcoming event is the US presidential election on November 5th. The last three presidential election years saw the market decline between 6% and 10% ahead of Election Day. However, an election that is less competitive this time around might have less of an impact on the market. Current polling suggests a strong chance of a GOP sweep. If this trend holds or strengthens in the coming months, the market is unlikely to see significant volatility ahead of election day.
In summary, the macrocast™ outlook remains positive, and microcast™ continues to advocate for an aggressive allocation strategy. While macrocast™ is currently positive, the score of +2 only provides a small cushion before the model would call for reducing risk. Even though a strong first half of the year historically points to further gains, volatility should be expected. While Powell’s upcoming speech and the US election could potentially result in a market pullback, we anticipate any decline to be temporary and minor. We will actively monitor signals from both macrocast™ and microcast™, using them to guide tactical adjustments to their respective strategies.
IMPORTANT DISCLOSURES
The chart(s)/graph(s) shown is(are) for informational purposes only and should not be considered as an offer to buy, solicitation to sell, or recommendation to engage in any transaction or strategy. Past performance may not be indicative of future results. While the sources of information, including any forward-looking statements and estimates, included in this (these) chart(s)/graph(s) was deemed reliable, Corbett Road Wealth Management (CRWM), Spire Wealth Management LLC, Spire Securities LLC and its affiliates do not guarantee its accuracy.
The views and opinions expressed in this article are those of the authors as of the date of this publication, are subject to change without notice, and do not necessarily reflect the opinions of Spire Wealth Management LLC, Spire Securities LLC or its affiliates.
All information is based on sources deemed reliable, but no warranty or guarantee is made as to its accuracy or completeness. macrocastTM and microcastTM are proprietary indexes used by Corbett Road Wealth Management to help assist in the investment decision-making process. Neither the information provided by macrocastTM or microcastTM nor any opinion expressed herein considers any investor’s individual circumstances nor should it be treated as personalized advice. Individual investors should consult with a financial professional before engaging in any transaction or strategy. The phrase “the market” refers to the S&P 500 Total Return Index unless otherwise stated. The phrase “risk assets” refers to equities, REITs, high yield bonds, and other high volatility securities.
Use of Indicators
Corbett Road’s quantitative models utilize a variety of factors to analyze trends in economic conditions and the stock market to determine asset and sector allocations that help us gauge market movements in the short- and intermediate term. There is no guarantee that these models or any of the factors used by these models will result in favorable performance returns.
Individual stocks are shown to illustrate market trends and are not included as securities owned by CRWM. Any names held by CRWM is coincidental. To be considered for investment by CRWM, a security must pass the Firm’s fundamental review process, meet certain internal guidelines, and fit within the parameters of the Firm’s quantitative models.
Spire Wealth Management, LLC is a Federally Registered Investment Advisory Firm. Securities offered through an affiliated company, Spire Securities, LLC, a Registered Broker/Dealer and member FINRA/SIPC. Registration does not imply any level of skill or training.