

Rush Zarrabian, CFA®
Corbett Road
Managing Partner, Portfolio Manager
—
June 13, 2024
Summary
-
macrocast™ remains positive, indicating a low risk of a recessionary bear market. Our current microcast™ signal remains at an aggressive allocation. Both models continue to indicate a generally optimistic outlook for risk assets.
-
Despite unprecedented global challenges over the past four years, markets have proven resilient, driven largely by US innovation. While ongoing issues like elevated interest rates and uncertainty in monetary policy persist, the market’s ability to reach record highs in the face of recent turmoil suggests it may continue to defy expectations and weather these challenges.
-
Oil price fluctuations can significantly influence expected inflation rates, as shown by the correlation between oil prices and the 5-year breakeven inflation rate. Recently, a 10% decline in oil prices has led to lower inflation expectations, potentially easing one concern for the Federal Reserve as it decides on whether it should cut interest rates.
-
The S&P 500 rose more than 10% year-to-date through May. Historically, similar double-digit gains have been a positive signal for the months ahead. On average, the index has increased nearly 9% for the rest of the year, posting positive returns in 16 of the last 19 occurrences.
AGAINST MAJOR HEADWINDS, THE MARKET SITS NEAR ALL-TIME HIGHS
Since the start of the decade, the world has transformed dramatically, upending our preconceived notions of normalcy and stability. Consider the following:
- A global pandemic triggered unprecedented economic lockdowns, causing the fastest market crash since the Great Depression.
- Subsequent major supply chain bottlenecks disrupted industries worldwide.
- The first major war in Europe since the 1990s led to a significant spike in oil prices and other critical commodities.
- The highest inflation rates in four decades strained household budgets.
Despite the tumult of recent years, the US stock market has demonstrated resilience, largely due to the innovative drive of corporations, especially large, technology-focused firms in which the United States holds a dominant global position.
As the S&P 500 sits near record highs, it’s worth remembering that historically, investing at a new high has yielded higher average returns over the next several years than investing on any random day (chart from JP Morgan):

This isn’t to say that broader equity markets are without challenges. For instance, small-cap stocks have struggled due to the burden of higher interest rates, which increases their borrowing costs and hampers growth. Similarly, international stocks, particularly in emerging markets, have lagged because they lack significant exposure to the booming tech sector that has driven much of the US stock market’s recent gain.
Inflation remains above the Federal Reserve’s target, hinting at only one or two rate cuts this year. The growth driven by AI could slow down or—if the technology disappoints—prove to be a significant misallocation of capital, which would be worse.
However, these concerns seem less significant than the events we’ve weathered over the past few years. In other words, if the market could reach record highs despite the turmoil of the last four years, it’s hard to imagine it suffering long-term damage simply because inflation is slightly above target or because the Fed lowers interest rates at a marginally slower pace.
IF OIL PRICES REMAIN TAME, THEN ANOTHER SURGE IN INFLATION IS UNLIKELY
Changes in oil prices significantly impact expected inflation rates. The following chart illustrates the correlation between oil price fluctuations and the 5-year breakeven inflation rate, which represents the expected average annual inflation rate over the next five years. The 5-year breakeven rate is calculated by comparing the yields of regular government bonds to those of inflation-protected bonds, which adjust their payouts based on inflation. (Chart from Koyfin):
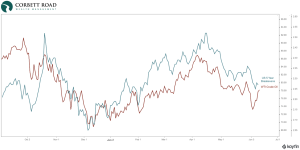
Oil prices have declined approximately 10% since their early April peak. Concurrently, inflation expectations decreased from 2.5% to 2.27%. Given the trend in inflation expectations is a key consideration in monetary policy, if oil prices stabilize or decline further, this would alleviate one concern for the Federal Reserve as it considers the timing and magnitude of potential interest rate cuts.
STRONG RETURNS THROUGH MAY USUALLY LED TO FURTHER GAINS
The S&P 500 is up more than 10% through May. Historically, the momentum continued after similar periods (table from Carson Group):

In almost all instances where the stock market saw double-digit gains through May, the rest of the year was positive with only three exceptions. In 1975, stocks ended slightly lower after a significant early surge. In 1986, despite a 2% decline over the final seven months, the market still finished the year with a substantial gain. Last, in the infamous 1987 crash, the market continued to rally for several months before the sharp October decline that was driven by idiosyncratic factors.
Overall, the market has historically shown higher average returns and more positive outcomes following a 10%+ gain through May compared to any random year since 1950.
In summary, the market has demonstrated remarkable resilience in the face of unprecedented challenges over the past few years, largely due to the innovation and strength of US companies. Looking ahead, falling oil prices have helped to ease inflation expectations, potentially alleviating the Fed’s concerns of resurgent inflation and allowing room for rate cuts. Following strong double-digit gains through May, history suggests a positive outlook for the rest of the year, further bolstering confidence in the market’s strength.
IMPORTANT DISCLOSURES
The chart(s)/graph(s) shown is(are) for informational purposes only and should not be considered as an offer to buy, solicitation to sell, or recommendation to engage in any transaction or strategy. Past performance may not be indicative of future results. While the sources of information, including any forward-looking statements and estimates, included in this (these) chart(s)/graph(s) was deemed reliable, Corbett Road Wealth Management (CRWM), Spire Wealth Management LLC, Spire Securities LLC and its affiliates do not guarantee its accuracy.
The views and opinions expressed in this article are those of the authors as of the date of this publication, are subject to change without notice, and do not necessarily reflect the opinions of Spire Wealth Management LLC, Spire Securities LLC or its affiliates.
All information is based on sources deemed reliable, but no warranty or guarantee is made as to its accuracy or completeness. macrocastTM and microcastTM are proprietary indexes used by Corbett Road Wealth Management to help assist in the investment decision-making process. Neither the information provided by macrocastTM or microcastTM nor any opinion expressed herein considers any investor’s individual circumstances nor should it be treated as personalized advice. Individual investors should consult with a financial professional before engaging in any transaction or strategy. The phrase “the market” refers to the S&P 500 Total Return Index unless otherwise stated. The phrase “risk assets” refers to equities, REITs, high yield bonds, and other high volatility securities.
Use of Indicators
Corbett Road’s quantitative models utilize a variety of factors to analyze trends in economic conditions and the stock market to determine asset and sector allocations that help us gauge market movements in the short- and intermediate term. There is no guarantee that these models or any of the factors used by these models will result in favorable performance returns.
Individual stocks are shown to illustrate market trends and are not included as securities owned by CRWM. Any names held by CRWM is coincidental. To be considered for investment by CRWM, a security must pass the Firm’s fundamental review process, meet certain internal guidelines, and fit within the parameters of the Firm’s quantitative models.
Spire Wealth Management, LLC is a Federally Registered Investment Advisory Firm. Securities offered through an affiliated company, Spire Securities, LLC, a Registered Broker/Dealer and member FINRA/SIPC. Registration does not imply any level of skill or training.