

Rush Zarrabian, CFA®
Corbett Road
Managing Partner, Portfolio Manager
—
March 15, 2024
Summary
-
macrocast™ remains positive and suggests the risk of a recessionary bear market in 2024 is low. Our current microcast™ signal remains at an aggressive allocation. Both models continue to indicate a generally optimistic outlook as the first quarter of 2024 comes to an end.
-
The global economy is showing signs of improvement, primarily led by the United States. Europe, on the other hand, may be heading toward a recession based on declining GDP estimates. China is taking proactive measures to stimulate its economy and prevent a slowdown.
-
The stock market has shown impressive gains over the past few months, with the S&P 500 rising over 20% since the end of October. Historically, strong winter performance and the absence of significant corrections are typically followed by further gains in the months following. While these trends are not guaranteed to continue, they provide an optimistic outlook for the market’s near-term future.
-
Although the current market rally is encouraging, it’s crucial to remember that corrections are a normal and healthy part of the market cycle. Historical examples from the late 1990s show that even during periods of exceptional growth, double-digit drawdowns can occur along the way.
GLOBAL GROWTH GETS A BOOST, LED BY U.S. STRENGTH
The global economy appears to be improving, largely driven by strength in the United States. In contrast, GDP estimates in Europe have been trending lower, suggesting a potential recession. Meanwhile, China is deploying a multi-pronged stimulus program to counter a potential economic slowdown. In an effort to stimulate their economy, China’s central bank recently lowered the amount of cash banks are required to hold, which policymakers hope will free up capital for lending to businesses and consumers (chart from Truist):

MARKET MOMENTUM SIGNALS POTENTIAL FOR MORE UPSIDE
The market has experienced several positive price trends over the past month, including gains across major indices and various sectors. These trends suggest potential for further growth in the months ahead. Consider the following:
- The recent performance of the S&P 500 has been remarkably strong. The S&P 500 is up more than 20% over the past four months. Historically, similar periods of strength have been followed by gains of almost 19% for the S&P 500 over the next year, and since 1970, the market has always closed higher in these instances (table from Canaccord Genuity):

- Historical data suggests that strong winter performance in the stock market often leads to further gains. The market was up in November, December, January, and February. Similar instances of four consecutive monthly gains have occurred eight times since 1950. In each of these instances, the market was higher a year later, with an average gain of 16% (table from Carson Group):

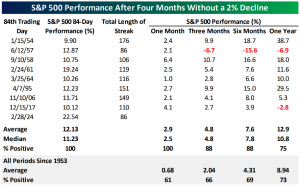
- Contrary to popular belief, a lack of correction in the stock market is not necessarily a bearish signal. It’s been four months since the S&P 500 had a 2% decline. That’s incredibly rare, with only 8 occurrences since 1953. In 7 out of 8 instances, the market was higher six months later, with an average gain of almost 8%. While this trend cannot continue indefinitely, it is encouraging to see that similar periods of strength were not followed by a bear market over the next year (table from Bespoke Investment Group):
EVEN STRONG BULL MARKETS NEED A BREATHER
The potential for a larger pullback in the future is higher the longer the rally continues without one. However, a moderate drawdown can be a healthy sign, helping to cool off sentiment and potentially extending the overall uptrend.
In a recent article, Ben Carlson reminded us of the incredible returns for the market in the second half of the 1990s:
1995: +37%
1996: +23%
1997: +33%
1998: +28%
1999: +21%
Along the way, there were 3 double-digit drawdowns:
- Asian Financial Crisis (1997): This crisis began in Thailand and spread to other Asian economies, causing significant instability in global markets. Concerns about the impact on the global economy led to an 11% decline in the S&P 500.
- Russian Financial Crisis/LTCM (1998): Russia’s economic collapse and debt default raised concerns about the health of emerging markets, triggering major losses at the hedge fund Long Term Capital Management. From July to August, the market dropped 19%.
- Y2K Concerns (1999): In the lead-up to the year 2000, there were anxieties about potential computer malfunctions (the Y2K bug) that might disrupt businesses and the economy. This uncertainty along with worries about Fed hikes led to a correction of 12%.
While our analysis suggests a potentially bullish market based on the previous section, it is important to remember that corrections are a normal part of the market cycle. Historically, declines of 5-10% have recovered within an average of two months and 10-20% declines have rebounded within an average of four months. The timeframe for recovery can vary, but the key for investors is to maintain a long-term perspective and avoid making impulsive decisions based on short-term volatility (chart from Bloomberg):

In summary, the global economy is showing signs of improvement, led by the United States. While Europe faces potential recession risks, the world’s second largest economy, China, is implementing stimulus measures to counter a slowdown. The stock market has exhibited strong momentum in recent months, with historical data suggesting the potential for further gains. However, even strong bull markets experience corrections along the way, as seen in the late 1990s. While the current rally is encouraging, investors should maintain a long-term perspective and be prepared for the possibility of a pullback, which can be a healthy development for the overall market trend.
IMPORTANT DISCLOSURES
The chart(s)/graph(s) shown is(are) for informational purposes only and should not be considered as an offer to buy, solicitation to sell, or recommendation to engage in any transaction or strategy. Past performance may not be indicative of future results. While the sources of information, including any forward-looking statements and estimates, included in this (these) chart(s)/graph(s) was deemed reliable, Corbett Road Wealth Management (CRWM), Spire Wealth Management LLC, Spire Securities LLC and its affiliates do not guarantee its accuracy.
The views and opinions expressed in this article are those of the authors as of the date of this publication, are subject to change without notice, and do not necessarily reflect the opinions of Spire Wealth Management LLC, Spire Securities LLC or its affiliates.
All information is based on sources deemed reliable, but no warranty or guarantee is made as to its accuracy or completeness. macrocastTM and microcastTM are proprietary indexes used by Corbett Road Wealth Management to help assist in the investment decision-making process. Neither the information provided by macrocastTM or microcastTM nor any opinion expressed herein considers any investor’s individual circumstances nor should it be treated as personalized advice. Individual investors should consult with a financial professional before engaging in any transaction or strategy. The phrase “the market” refers to the S&P 500 Total Return Index unless otherwise stated. The phrase “risk assets” refers to equities, REITs, high yield bonds, and other high volatility securities.
Use of Indicators
Corbett Road’s quantitative models utilize a variety of factors to analyze trends in economic conditions and the stock market to determine asset and sector allocations that help us gauge market movements in the short- and intermediate term. There is no guarantee that these models or any of the factors used by these models will result in favorable performance returns.
Individual stocks are shown to illustrate market trends and are not included as securities owned by CRWM. Any names held by CRWM is coincidental. To be considered for investment by CRWM, a security must pass the Firm’s fundamental review process, meet certain internal guidelines, and fit within the parameters of the Firm’s quantitative models.
Spire Wealth Management, LLC is a Federally Registered Investment Advisory Firm. Securities offered through an affiliated company, Spire Securities, LLC, a Registered Broker/Dealer and member FINRA/SIPC. Registration does not imply any level of skill or training.