

CHARTING THE COURSE 2025
Rush Zarrabian, CFA®
Corbett Road
Managing Partner, Portfolio Manager
—
August 19, 2025
Summary
-
Every August, we “Chart the Course” with a series of charts that highlight key current and historical trends in the economy and markets. We hope you find them both insightful and useful. Our regular commentary will resume in September.
-
The microcast™ signal remains at an aggressive allocation. The alignment of both models reflects a constructive outlook for risk assets.
CHARTING THE COURSE: THE ECONOMY
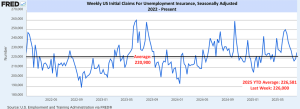
Jobs data is often revised multiple times to improve accuracy as more complete information becomes available. Lately, those revisions have been negative. Every 2025 jobs report so far has been revised lower—some by more than 100,000 positions. This pattern suggests early optimism is consistently tempered by later data, raising questions about the labor market’s true strength and its impact on economic momentum. That said, other key employment indicators, such as initial jobless claims, remain far more constructive (first chart from 3Fourteen, second from DataTrek):

CHARTING THE COURSE: THE FED
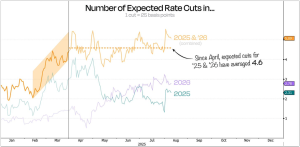
Markets are bracing for steady rate cuts. Since April, expectations for combined 2025 and 2026 rate cuts have hovered around 4.6, equivalent to more than a full percentage point of easing. While the outlook for rates over the next two years has been remarkably stable, the split now shows 2025 carrying just over two cuts and 2026 nearly three. The consistency suggests investors believe the Fed will take a gradual, multi-year approach to lowering rates (chart from Duality Research):
CHARTING THE COURSE: TARIFFS
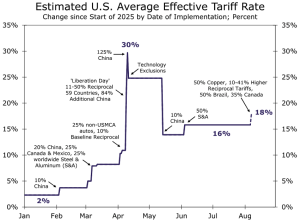
A historic rise in tariffs: The average effective U.S. tariff rate jumped from 2% in January to a peak of 30% in April, before easing to current estimates around 18%. Successive rounds of reciprocal tariffs and sector-specific hikes—from autos to copper—are reshaping global supply chains and influencing costs, corporate margins, and consumer prices. The situation remains fluid, and today’s rate is unlikely to be the final average (chart from Wells Fargo):
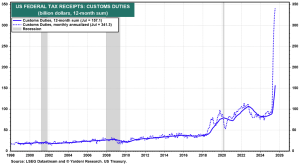
Tariffs are fueling a historic surge in customs duties. U.S. customs duty receipts hit unprecedented levels in July, with the monthly annualized rate topping $340 billion, more than triple previous peaks. Wells Fargo estimates annual tariff collections could reach as high as $580 billion (chart from Yardeni Research):
CHARTING THE COURSE: THE MAGNIFICENT 7
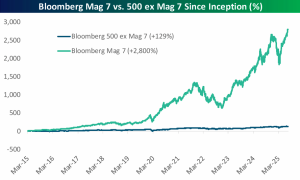
Seven stocks have carried the market on their backs. Since its launch in early 2015, Bloomberg’s Mag 7 index—tracking the seven dominant mega-cap stocks—has skyrocketed 2,800%, compared to just 129% for the 493 largest non-Mag 7 companies. This staggering gap means the vast majority of the market’s headline growth over the past ten years can be traced to a handful of tech-leading giants, underscoring both their dominance and the market’s narrowing leadership (chart from Bespoke):
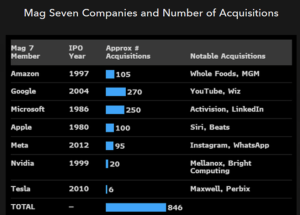
They may be just seven stocks, but there’s a lot more beneath the surface. The Magnificent 7 have made a combined 846 acquisitions—led by Google with 270 and Microsoft with 250. From headline-grabbing deals like YouTube, LinkedIn, and Whole Foods to quieter, strategic buys, these companies have consistently expanded their reach. Each move has tightened their grip on entire sectors and reshaped the business landscape (table via Eric Balchunas/Bloomberg Intelligence):
CHARTING THE COURSE: MARKET HISTORY
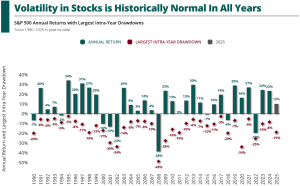
The stock market is up 10% year to date—right in line with the “average”—but an average year is anything but typical. Since 1950, S&P 500 gains between 8–10% have been rare. Most years deliver returns well above or below that range, with double-digit swings in either direction. For investors, the priority isn’t expecting an “average” year, it’s building a plan that can handle the full range of outcomes (chart from Carson):

Every year, the market experiences at least some kind of pullback. The S&P 500 may be up 10% year to date, but that followed a 19% drop into the April lows— with over half of those losses occurring in the four days prior to the bottom. Equities can deliver substantial rewards over the long term, but those gains almost always come with short-term volatility (chart from Exhibit A, Data from S&P Global):
The longer you invest, the greater your chance of facing a bear market. A downturn isn’t optional, it’s inevitable. Since 1950, the odds of a 20% market drop have risen with time invested. Historical odds of experiencing a bear market were 31% for a one-year holding period, 59% over three years, and investors with a 10-15 year horizon were nearly guaranteed to experience at least one 20% decline. Volatility is simply part of the journey. The goal isn’t to avoid it, but to build a portfolio and withdrawal strategy that can withstand bear markets, so you stay invested and capture the recoveries that follow (chart from Exhibit A):

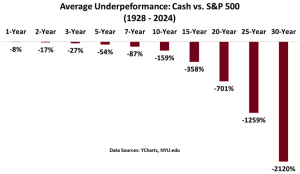
And playing it safe might be the riskiest move of all. Over the past century, choosing cash over equities has meant steadily falling behind. On average, over a ten-year holding period, cash has lagged the S&P 500 by an average of 159%. Over thirty years, the gap widens to more than 2,000%. Inflation only deepens the loss, making a disciplined equity allocation essential for preserving long-term purchasing power (chart from Charlie Bilello):
Important Disclosures
The chart(s)/graph(s) shown is(are) for informational purposes only and should not be considered as an offer to buy, solicitation to sell, or recommendation to engage in any transaction or strategy. Past performance may not be indicative of future results. While the sources of information, including any forward-looking statements and estimates, included in this (these) chart(s)/graph(s) was deemed reliable, Corbett Road Wealth Management (CRWM), Spire Wealth Management LLC, Spire Securities LLC and its affiliates do not guarantee its accuracy.
The views and opinions expressed in this article are those of the authors as of the date of this publication, are subject to change without notice, and do not necessarily reflect the opinions of Spire Wealth Management LLC, Spire Securities LLC or its affiliates.
All information is based on sources deemed reliable, but no warranty or guarantee is made as to its accuracy or completeness. macrocastTM and microcastTM are proprietary indexes used by Corbett Road Wealth Management to help assist in the investment decision-making process. Neither the information provided by macrocastTM or microcastTM nor any opinion expressed herein considers any investor’s individual circumstances nor should it be treated as personalized advice. Individual investors should consult with a financial professional before engaging in any transaction or strategy. The phrase “the market” refers to the S&P 500 Total Return Index unless otherwise stated. The phrase “risk assets” refers to equities, REITs, high yield bonds, and other high volatility securities.
Use of Indicators
Corbett Road’s quantitative models utilize a variety of factors to analyze trends in economic conditions and the stock market to determine asset and sector allocations that help us gauge market movements in the short- and intermediate term. There is no guarantee that these models or any of the factors used by these models will result in favorable performance returns.
Individual stocks are shown to illustrate market trends and are not included as securities owned by CRWM. Any names held by CRWM is coincidental. To be considered for investment by CRWM, a security must pass the Firm’s fundamental review process, meet certain internal guidelines, and fit within the parameters of the Firm’s quantitative models.
Spire Wealth Management, LLC is a Federally Registered Investment Advisory Firm. Securities offered through an affiliated company, Spire Securities, LLC, a Registered Broker/Dealer and member FINRA/SIPC. Registration does not imply any level of skill or training.
Archive
About Corbett Road
Useful Links
Contact Us
Toll Free: 844.688.4955
E-mail: info@corbettroad.com
7901 Jones Branch Drive Suite 800 McLean, VA 22102
7901 Jones Branch Drive Suite 800 McLean, VA 22102
All third-party trademarks and service marks on the Corbett Road Wealth Management website (www.corbettroad.com) are the property of their respective owners, and the use of these names, trademarks and brands does not imply endorsement.
Spire Wealth Management, LLC is a Federally Registered Investment Advisory firm. Securities offered through an affiliate, Spire Securities, LLC. Member FINRA/SIPC | DISCLAIMERS.
©Copyright 2024 Corbett Road Wealth Management. All rights reserved. FINRA Broker Check Spire Investment Partners