

FIRST HALF OF 2025 MARKET REVIEW: A ROLLER COASTER RIDE TO RECORD HIGHS
Rush Zarrabian, CFA®
Corbett Road
Managing Partner, Portfolio Manager
—
July 16, 2025
Summary
- The newly signed tax bill passed by Congress and the President the first week of July delivers front-loaded stimulus aimed at boosting near-term growth while cushioning tariff impacts. Despite longer-term deficit concerns, it’s a net positive for the economy in the short run.
- U.S. large-cap stocks ended the quarter with gains of over 10%—but that headline number doesn’t capture the full story. The quarter kicked off with a sharp drop, as the S&P 500 plunged 12% in just four trading days. Yet, by June 30, the market had not only erased those losses but gone on to set new all-time highs.
- A powerful two-month rally and record-high earnings estimates signal further market momentum. Historically, stocks have delivered stronger returns when earnings are rising, and sharp rebounds from bear markets have often led to sustainable gains in the following year.
- MX strategies moved to an aggressive allocation in early July, following the expiration of our “rate of change” sell signal. microcast™ was also upgraded to an aggressive stance at the end of June. This marks the first time since November 2024 that both models are aligned in recommending an aggressive allocation, suggesting a more constructive environment for risk assets.
QUICK THOUGHTS ON THE RECENT TAX BILL
On July 4th, President Trump signed into law the long-awaited tax-and-spending bill—formerly known as the “One Big, Beautiful Bill”—that Congress had been crafting for months. While the policy details are extensive, our focus here is on its near-term impact on the federal deficit and economic stimulus. The chart below outlines the bill’s spending and saving components over the next decade (from Credit Agricole):

The key takeaway: most of the stimulus is front-loaded, while the spending cuts are pushed to later years. This timing matters. By injecting money into the economy now, the bill could help lower the risk of recession and soften the blow from tariff-related costs.
While there are valid concerns about the long-term impact of a growing federal deficit, the bill is now law. On balance, it’s a short-term positive for the economy.
FIRST HALF OF 2025 ASSET CLASS REVIEW
By the numbers, the first half of 2025 appears uneventful. With the exception of strong international stock performance, returns across most asset classes were fairly average. But those ending numbers masked a roller coaster ride. Markets once again proved that while “buy and hold” is easy to say, it’s hard to live through. The second quarter began with shock and uncertainty but quickly flipped into one of the sharpest V-shaped rebounds on record.
The following table highlights major asset class returns during the second quarter and the first half of the year (data from Morningstar Direct):

Some additional insights from the above table:
1. A round trip: from all-time highs to a tariff-driven bear market to new record highs. Despite the noise, markets ended the first half of 2025 close to where they started. The S&P 500 hit a new high in February, then plunged nearly 20% by early April. Yet, by quarter’s end, it had not only recovered but set fresh all-time highs—a rebound that would’ve seemed unthinkable in the immediate aftermath of the tariff shock (chart from RBC):

2. The dollar just posted its worst first-half performance since 1973. Amid unprecedented levels of economic uncertainty, the U.S. Dollar Index fell 11%—a level of decline not seen since 1986, and the steepest drop in over 50 years (chart from Bloomberg):

3. Dollar weakness gave international stocks a major boost, fueling their strongest relative performance since 2009. The dollar’s loss became global equities’ gain. The last time international stocks outperformed U.S. equities to this degree was in early 2009, during the post–Global Financial Crisis rebound (Chart from Bespoke):

4. The Nasdaq’s rebound was historic, echoing the aftermath of past crises. The tech-heavy Nasdaq 100 index surged more than 25% in just two months, a feat seen only during major turning points like the dot-com bubble, the end of the Global Financial Crisis, and the COVID recovery (chart from MarketDesk):

![]()
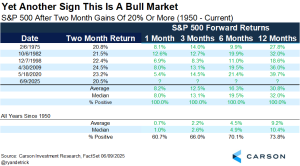
A POWERFUL MARKET REBOUND TENDS TO
PRECEDE FURTHER UPSIDE
The sharp rebound in stocks, combined with a solid outlook for corporate earnings, suggests this rally may still have room to run. The S&P 500 has climbed more than 20% in just two months—a rare move seen only five times since 1950. In every one of those cases, the market was higher a year later, with an average gain of 30% (table from Carson):
In addition, the rally from early April to late June ranks among the 20 strongest since 1989. Historically, markets have always been higher 12 and 24 months after rallies of this magnitude (from Charlie Bilello):

Lastly, earnings estimates for the S&P 500 just hit a new all-time high. This is bull market behavior. According to a study by 3Fourteen Research, the market tends to perform better and experience smaller drawdowns when analysts are raising estimates, with a compound annual growth rate (CAGR) of over 12%. While stocks can still post gains when estimates aren’t at record highs, those returns tend to be lower and far more volatile (chart from 3Fourteen):

In summary, the first half of 2025 delivered a market narrative that few could have predicted: a swift tariff-induced downturn followed by one of the fastest rebounds in history. With the new tax bill injecting near-term stimulus, corporate earnings forecasts reaching new highs, and price momentum pointing upward, the market’s foundation looks robust. Historical patterns back this optimism—rallies of this magnitude have been rare and have consistently led to strong forward returns, with rising earnings estimates cushioning volatility. While long-term concerns like the federal deficit and geopolitical risk remain, the evidence favors staying invested and balanced as the second half of 2025 unfolds.

Important Disclosures
The chart(s)/graph(s) shown is(are) for informational purposes only and should not be considered as an offer to buy, solicitation to sell, or recommendation to engage in any transaction or strategy. Past performance may not be indicative of future results. While the sources of information, including any forward-looking statements and estimates, included in this (these) chart(s)/graph(s) was deemed reliable, Corbett Road Wealth Management (CRWM), Spire Wealth Management LLC, Spire Securities LLC and its affiliates do not guarantee its accuracy.
The views and opinions expressed in this article are those of the authors as of the date of this publication, are subject to change without notice, and do not necessarily reflect the opinions of Spire Wealth Management LLC, Spire Securities LLC or its affiliates.
All information is based on sources deemed reliable, but no warranty or guarantee is made as to its accuracy or completeness. macrocastTM and microcastTM are proprietary indexes used by Corbett Road Wealth Management to help assist in the investment decision-making process. Neither the information provided by macrocastTM or microcastTM nor any opinion expressed herein considers any investor’s individual circumstances nor should it be treated as personalized advice. Individual investors should consult with a financial professional before engaging in any transaction or strategy. The phrase “the market” refers to the S&P 500 Total Return Index unless otherwise stated. The phrase “risk assets” refers to equities, REITs, high yield bonds, and other high volatility securities.
Use of Indicators
Corbett Road’s quantitative models utilize a variety of factors to analyze trends in economic conditions and the stock market to determine asset and sector allocations that help us gauge market movements in the short- and intermediate term. There is no guarantee that these models or any of the factors used by these models will result in favorable performance returns.
Individual stocks are shown to illustrate market trends and are not included as securities owned by CRWM. Any names held by CRWM is coincidental. To be considered for investment by CRWM, a security must pass the Firm’s fundamental review process, meet certain internal guidelines, and fit within the parameters of the Firm’s quantitative models.
Spire Wealth Management, LLC is a Federally Registered Investment Advisory Firm. Securities offered through an affiliated company, Spire Securities, LLC, a Registered Broker/Dealer and member FINRA/SIPC. Registration does not imply any level of skill or training.
Archive
About Corbett Road
Useful Links
Contact Us
Toll Free: 844.688.4955
E-mail: info@corbettroad.com
7901 Jones Branch Drive Suite 800 McLean, VA 22102
7901 Jones Branch Drive Suite 800 McLean, VA 22102
All third-party trademarks and service marks on the Corbett Road Wealth Management website (www.corbettroad.com) are the property of their respective owners, and the use of these names, trademarks and brands does not imply endorsement.
Spire Wealth Management, LLC is a Federally Registered Investment Advisory firm. Securities offered through an affiliate, Spire Securities, LLC. Member FINRA/SIPC | DISCLAIMERS.
©Copyright 2025 Corbett Road Wealth Management. All rights reserved. FINRA Broker Check Spire Investment Partners