

Rush Zarrabian, CFA®
Corbett Road
Managing Partner, Portfolio Manager
—
September 18, 2025
Summary
-
The Federal Reserve has resumed rate cuts. As expected, the central bank lowered the benchmark rate by 0.25% in this month’s meeting, and the updated dot plot points to two additional rate cuts by year-end. Inflation remains sticky, but the Fed’s bigger worry is the labor market, which has clearly weakened and now demands attention.
-
Job growth has stalled, with June posting the first payroll contraction since 2020—the key reason the Fed is cutting rates. While payrolls have clearly weakened, leading job indicators like overtime and temp hiring remain more resilient, suggesting we are not at recessionary levels yet.
-
Rate cuts most directly affect short-term fixed income assets, with money market yields expected to fall by year-end. The effect on mortgage rates is less predictable, while longer-duration equities typically benefit from lower rates. On average, stocks have gained about 10% after the Fed begins or resumes cutting rates. Further, stock returns tend to be even higher when the rate cut occurs with the market near an all-time high.
-
Markets spend most of their time below all-time highs. Since 1950, the S&P 500 has been in a 3% drawdown more than 60% of the time. This isn’t a sign something is wrong, but simply the nature of markets. New peaks emerge only after long stretches in between, making patience an essential part of investing.
-
macrocast™ remains modestly positive, indicating a low risk of a recessionary bear market. Our current microcast™ signal remains at an aggressive allocation. Both models suggest a positive outlook for risk assets.
ANOTHER RATE CUTTING CYCLE HAS BEGUN
The Federal Reserve resumed cutting rates this week. Last year, the central bank began lowering rates—cutting the benchmark rate by a full percentage point—before pausing in December. The last move was a 0.25% cut, bringing the target range for the Federal funds rate to 4.25-4.50%.
Since then, policymakers have taken a “wait and see” approach, pausing further rate cuts while they assess the potential economic impact of policy changes. Their chief concern was the new administration’s tariff policy reigniting inflation.
While certain measures of inflation are running hotter than they were a year ago during the last cutting phase, Fed officials are looking past the temporary impact of tariffs and have started a new easing cycle this week. In line with investor expectations, the Fed cut rates by another 0.25%, lowering the benchmark target rate to 4.00-4.25%. Further, the updated dot plot, provided in the Fed’s summary of economic projections, points to two additional 0.25% cuts by the end of this year.
CUTTING RATES WHILE INFLATION RUNS ABOVE TARGET
Why is the Fed cutting rates while inflation still looms? Because they’re worried about the labor market. U.S. job growth has slowed sharply over the past two years. After the latest revisions, June’s non-farm payrolls print turned negative, the first contraction since 2020 (chart from Bloomberg):
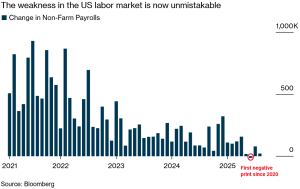
This, above all other factors, is why the Fed is cutting rates. Officials are betting that any inflation from tariffs will prove temporary, while job losses—if left unchecked—could snowball into a recession. A modest 1-2% rise in inflation would be far less damaging than a collapse in the labor market.
Avoiding recession is critical for the stock market. The chart below shows S&P 500 performance after the first negative payrolls print in at least 12 months. The difference is stark: when no recession follows, stocks tend to rally; when recession hits, they struggle (from 3Fourteen Research):

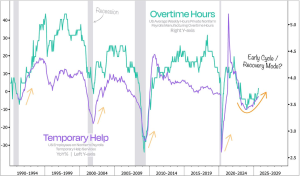
One silver lining: the monthly jobs report is mostly a lagging indicator. It tells us more about where the economy has been than where it’s going. More forward-looking measures of labor demand, such as overtime hours and temp hiring, appear to be improving (chart from Duality Research):
THE IMPLICATIONS OF RATE CUTS FOR INVESTORS
The most immediate impact of Fed rate cuts is on short-term fixed income assets. Money market funds, CDs, and short-term Treasuries typically move in near lockstep with monetary policy. For example, if money market funds yield 4% today and the central bank makes three quarter-point cuts by year-end, the yield on these funds would likely fall to roughly 3.25%.
Mortgage rates, by contrast, are less predictable. They track the 10-year Treasury yield, which doesn’t always fall when the Fed cuts rates. In fact, yields can rise if investors believe easier monetary policy will spur stronger economic growth. That’s exactly what happened last year: after the Fed cut rates by 1% beginning in September 2024, the 10-year yield rose, and mortgage rates climbed by nearly a full percentage point (chart from St. Louis Fed):

What about stocks? Once again, it comes down to avoiding recession. On average, the market has gained about 10% after the Fed begins or resumes cutting rates. The only cases where the market was lower a year later were the downturns that followed 9/11 and the Global Financial Crisis.
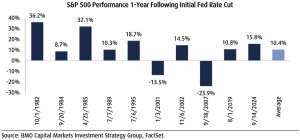
Because no one can ever know exactly when a recession will strike, a more useful analysis is rooted in what we do know, and that points to a more constructive outlook for stocks:
- Nautilus Research studied every instance when the Fed cut rates while the benchmark rate was above 2% and the market was within 10% of its highs — just like today. Six months later, the S&P 500 was higher 14 out of 16 times, with an average gain of 8%.
- Bespoke Investment Group analyzed every instance since 1994 when the Fed cut rates with the market within two weeks of an all-time high, regardless of whether it was the first cut, the last, or somewhere in between. The results were universally positive: one year later, the market was higher every single time, with an average gain of 14.5%.
DRAWDOWNS ARE THE RULE, NOT THE EXCEPTION
One of the most counterintuitive facts about investing is despite huge gains in the stock market over decades, the market (and therefore your account balance) is rarely at an all-time high.
Since 1950, the S&P 500 has spent over 60% of its time in a drawdown of 3% or more. Put simply: on any given day in history, the odds were nearly two-to-one that your portfolio sat below its peak (chart from Exhibit A):
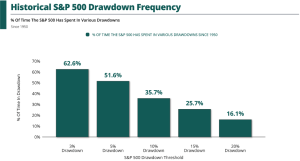
This is the normal state of investing. The key is to weather the dips between the peaks.
The mistake is thinking that being “off the highs” means something is wrong. It’s just how compounding works. Each new high eventually exceeds the last. Sometimes that requires enduring long stretches in between. Patience is a necessity when investing, and this is just more evidence of that fact.
In summary, the Fed has resumed cutting rates, not because inflation has vanished, but because rising job losses are the greater risk. History shows stocks tend to perform well after rate cuts, particularly when recession is avoided. And for now, our recession-focused risk model, macrocast™, suggests the risk of a recessionary bear market is low.

Important Disclosures
The chart(s)/graph(s) shown is(are) for informational purposes only and should not be considered as an offer to buy, solicitation to sell, or recommendation to engage in any transaction or strategy. Past performance may not be indicative of future results. While the sources of information, including any forward-looking statements and estimates, included in this (these) chart(s)/graph(s) was deemed reliable, Corbett Road Wealth Management (CRWM), Spire Wealth Management LLC, Spire Securities LLC and its affiliates do not guarantee its accuracy.
The views and opinions expressed in this article are those of the authors as of the date of this publication, are subject to change without notice, and do not necessarily reflect the opinions of Spire Wealth Management LLC, Spire Securities LLC or its affiliates.
All information is based on sources deemed reliable, but no warranty or guarantee is made as to its accuracy or completeness. macrocastTM and microcastTM are proprietary indexes used by Corbett Road Wealth Management to help assist in the investment decision-making process. Neither the information provided by macrocastTM or microcastTM nor any opinion expressed herein considers any investor’s individual circumstances nor should it be treated as personalized advice. Individual investors should consult with a financial professional before engaging in any transaction or strategy. The phrase “the market” refers to the S&P 500 Total Return Index unless otherwise stated. The phrase “risk assets” refers to equities, REITs, high yield bonds, and other high volatility securities.
Use of Indicators
Corbett Road’s quantitative models utilize a variety of factors to analyze trends in economic conditions and the stock market to determine asset and sector allocations that help us gauge market movements in the short- and intermediate term. There is no guarantee that these models or any of the factors used by these models will result in favorable performance returns.
Individual stocks are shown to illustrate market trends and are not included as securities owned by CRWM. Any names held by CRWM is coincidental. To be considered for investment by CRWM, a security must pass the Firm’s fundamental review process, meet certain internal guidelines, and fit within the parameters of the Firm’s quantitative models.
Spire Wealth Management, LLC is a Federally Registered Investment Advisory Firm. Securities offered through an affiliated company, Spire Securities, LLC, a Registered Broker/Dealer and member FINRA/SIPC. Registration does not imply any level of skill or training.